Wine Regions of France
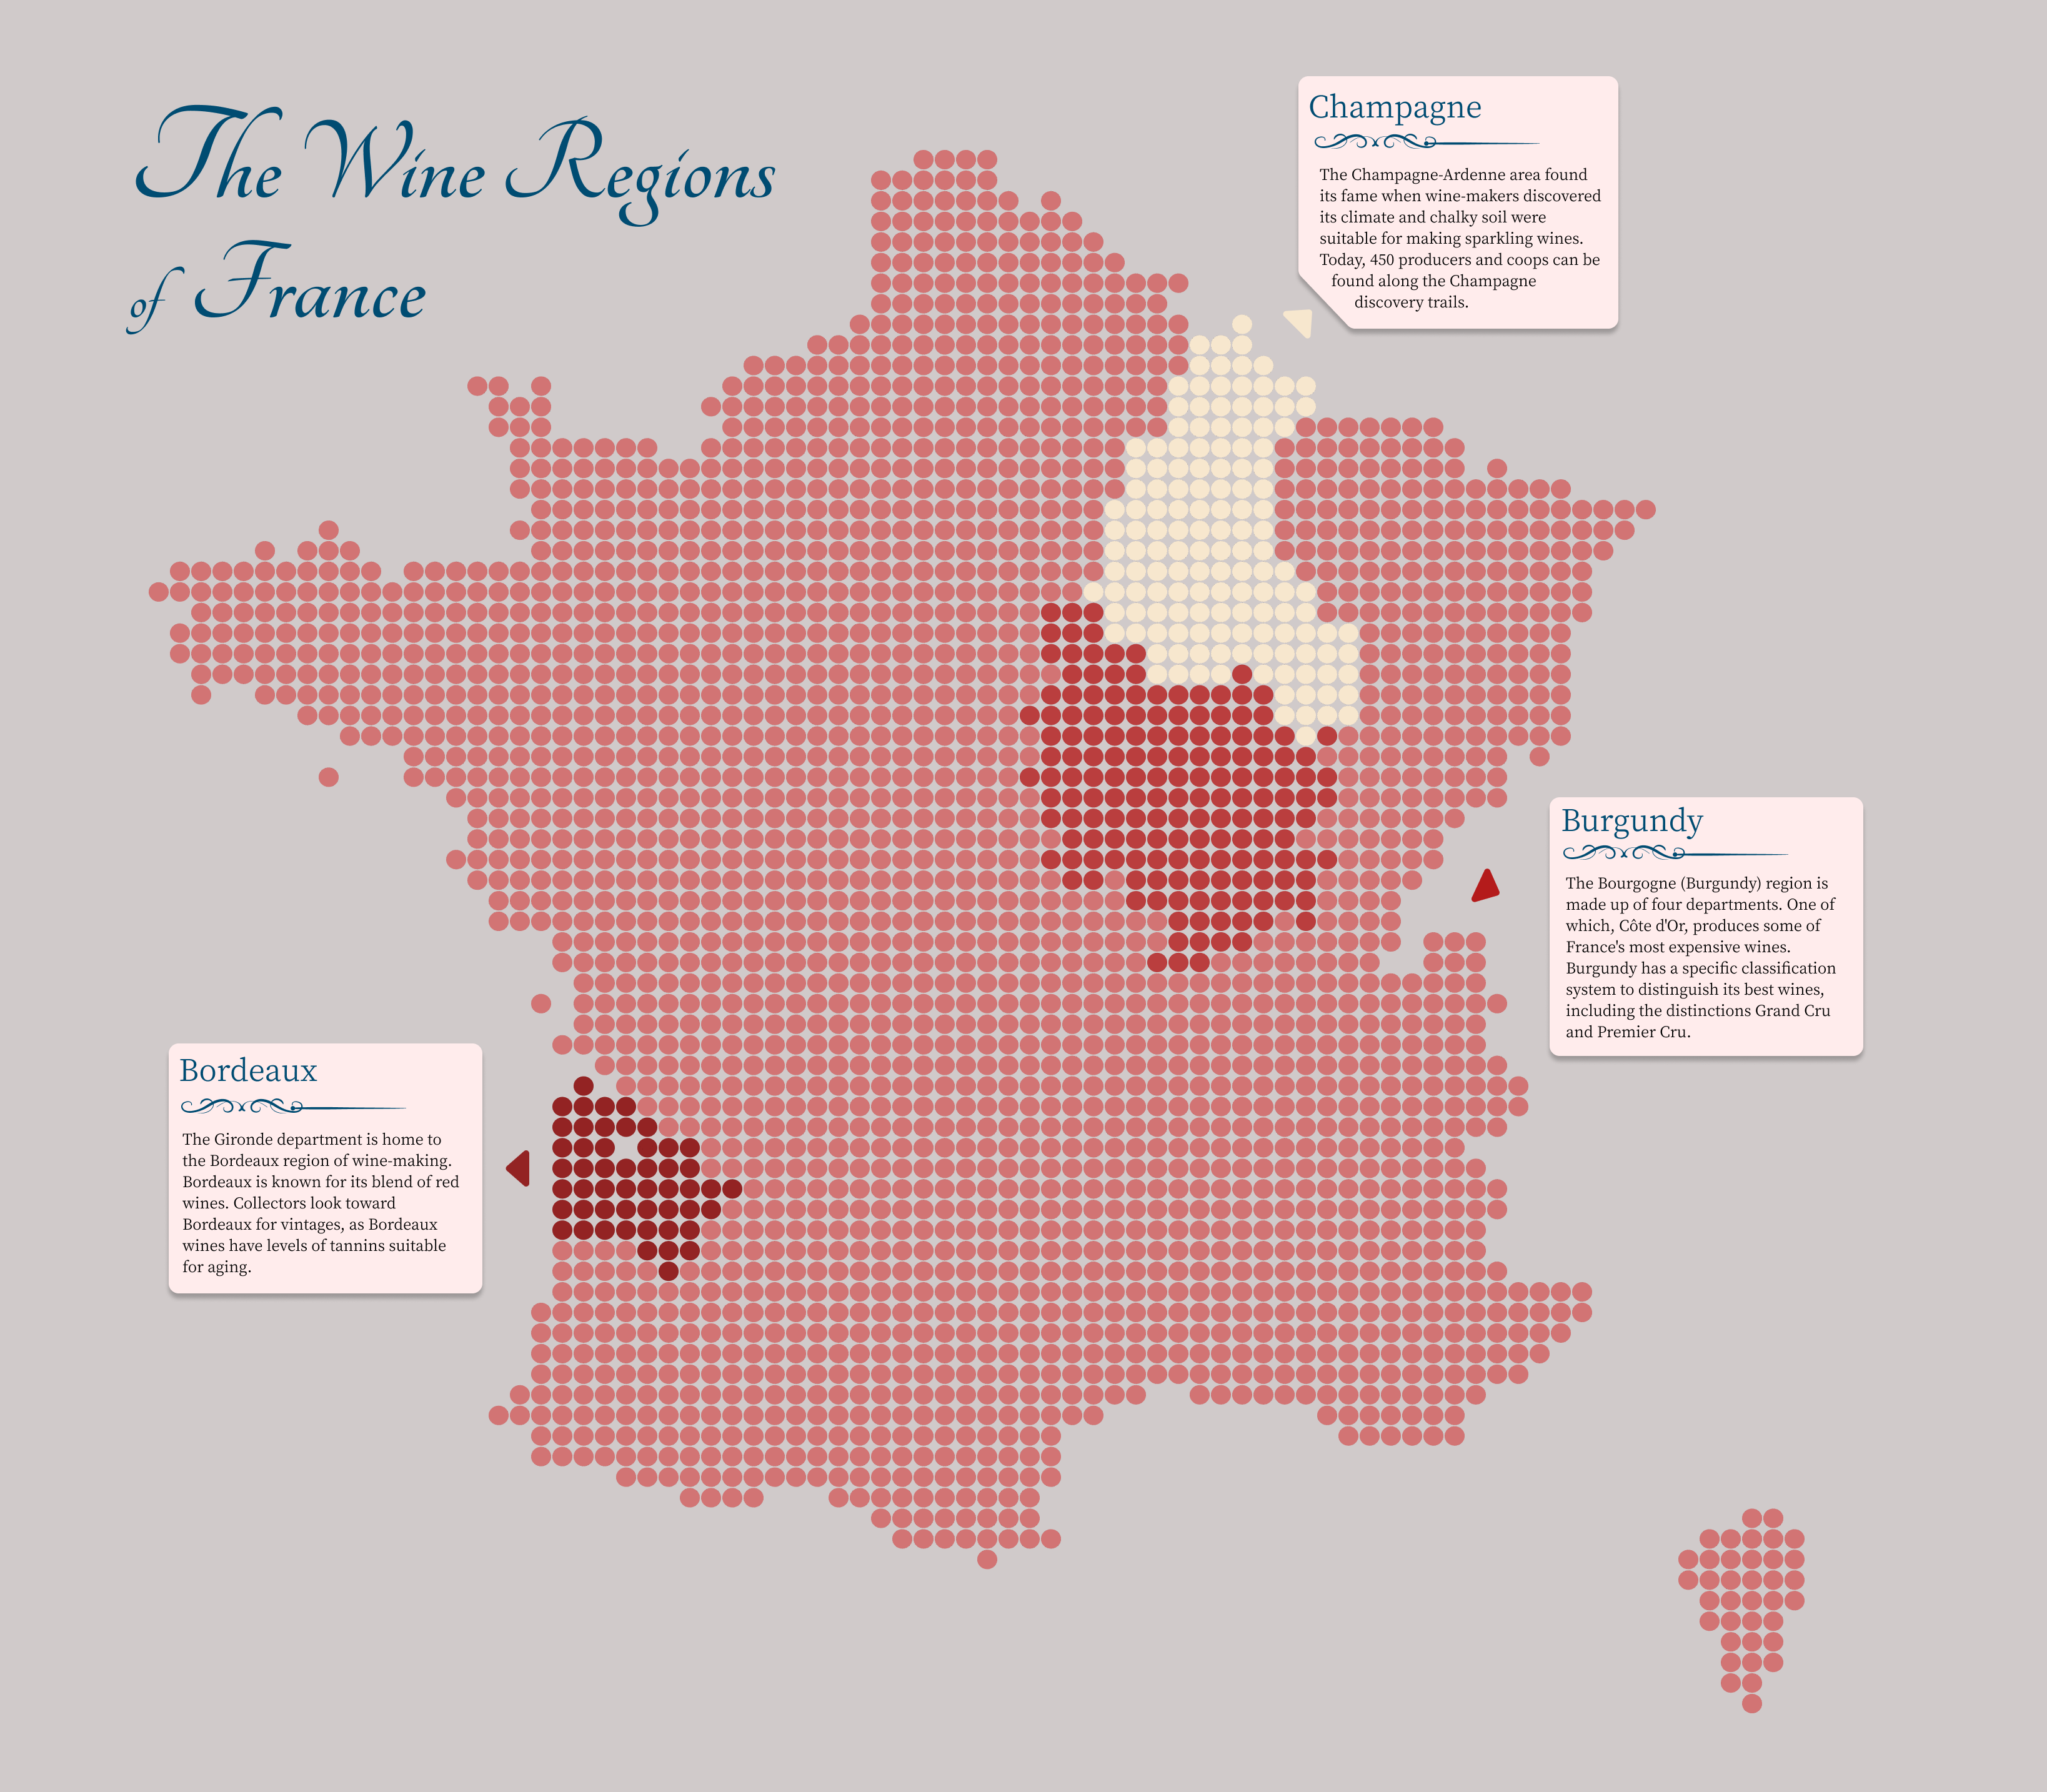
This pixel map visualization portrays the departments in which the three most popular wine regions of France live.
The base map was created using the pixel map generator tool from Amcharts.js. The visualization was annotated, labeled, and cleaned in Figma.
