Banner and Topline Software
This project in design and analysis features work from multiple NORC Venture Fund awards to build software to automate reporting at NORC of topline findings documents and banner tablatures.
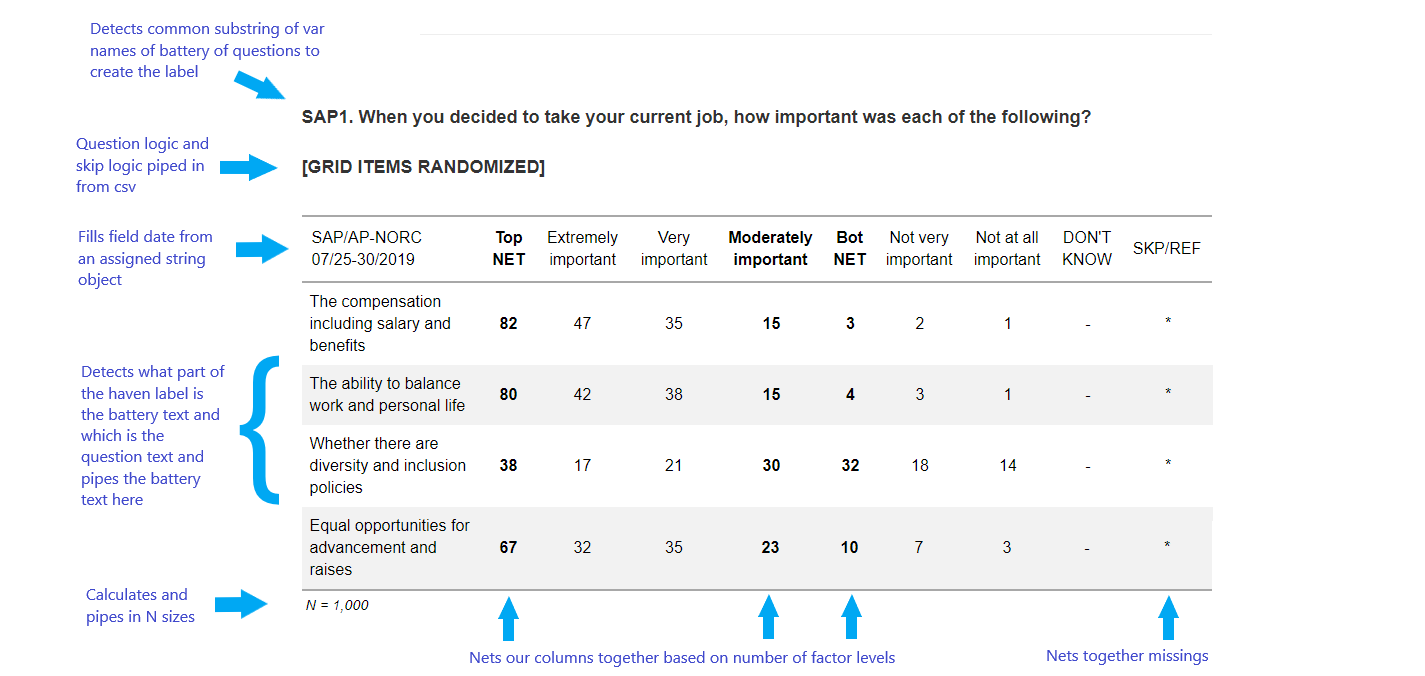
My colleagues and I were awarded two separate funding awards to produce tools for NORC to use to automate some reporting processes. I was the principal developer on both awards. On the former award, we created an R package to automate the reporting of topline findings documents.
The output utilized the R package GT to create sleek toplines.
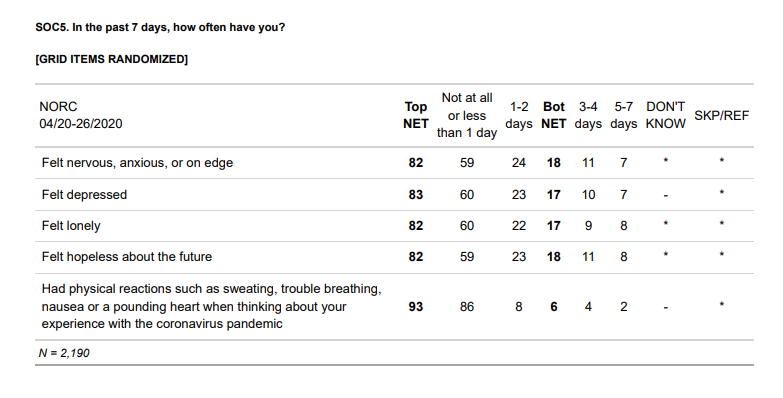
It featured a number of innovations in automation, piping in attributes from labeling and formatting of data, n sizes, and survey weighted frequencies.
The second award was to create a web application to assist in the production of banner tablatures. These sheets of tablatures display survey weighted frequencies cut across demographics with statistical tests to calculate statistical differences.
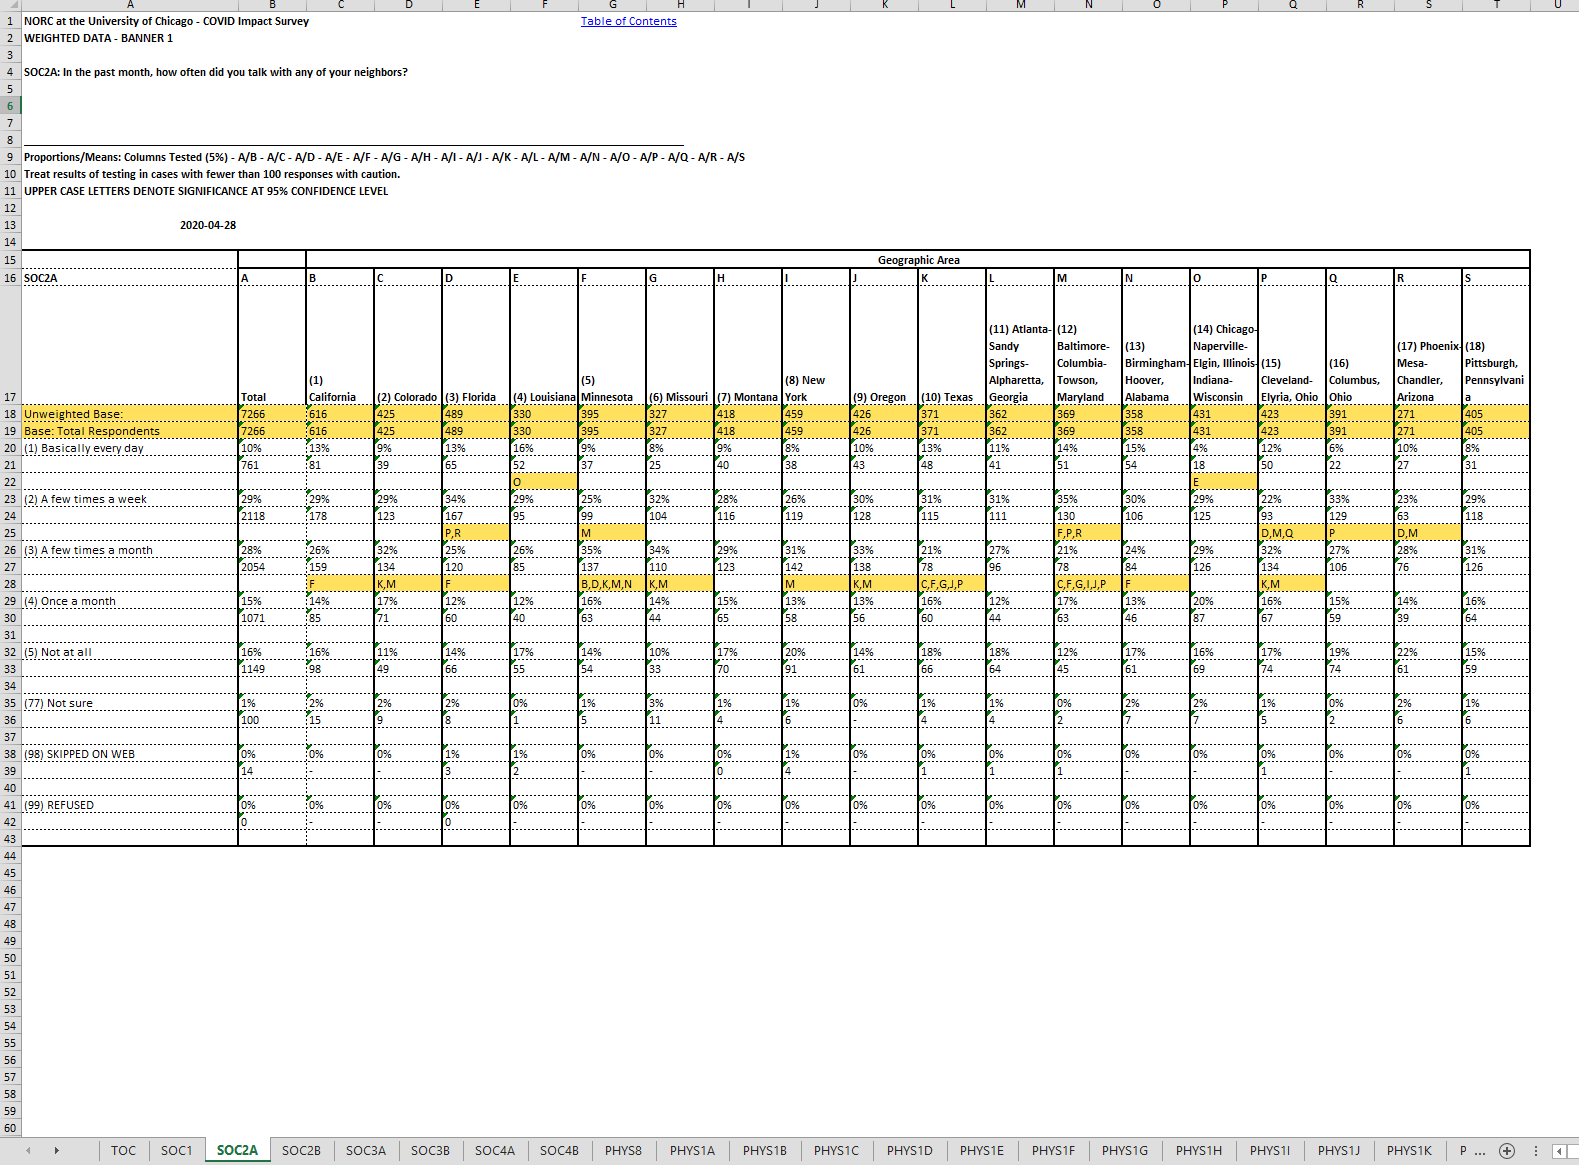
Our work helps deliver topline findings documents and banner tablatures for dozens of projects, including partnerships with University of Chicago Harris and Divinity School, Hampton University, Data Foundation, SAP, the American Press Institute, and the NSF.
An example of published versions of these results is the COVID Impact Study: