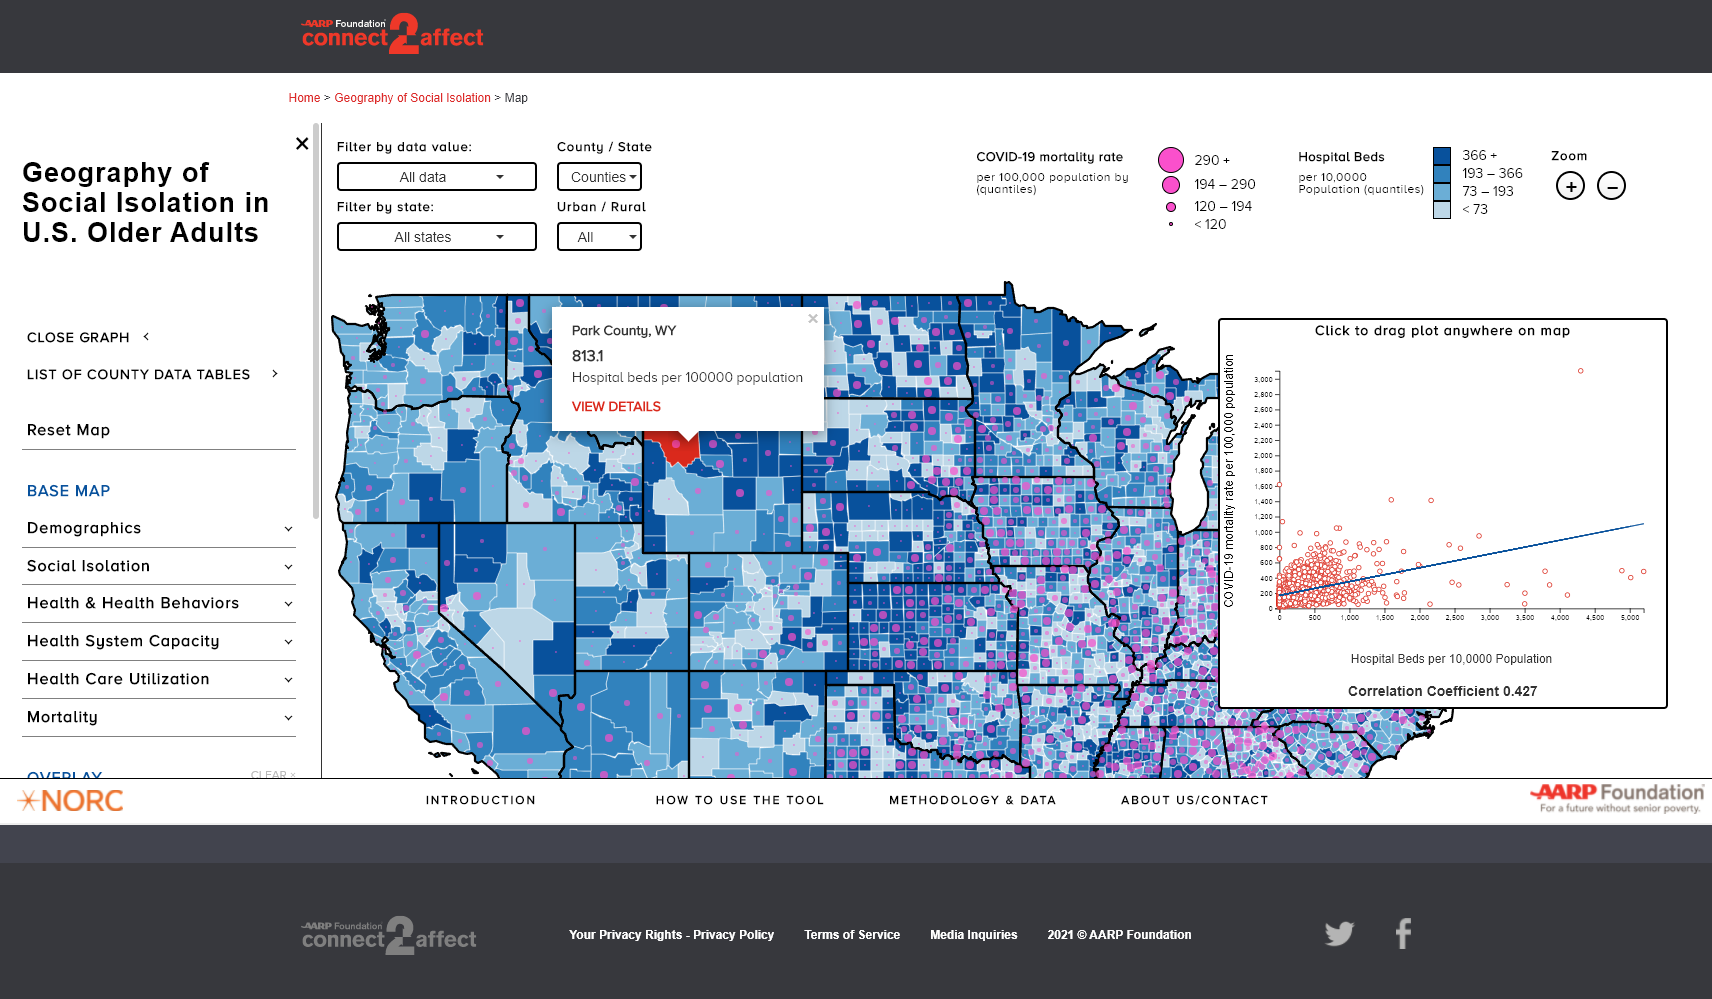
AARP social isolation mapping tool
While working at NORC, I helped develop this interactive map for the AARP Foundation's connect 2 affect program. The map was designed to help visualize social isolation and loneliness in older adults in the United States during the COVID-19 pandemic.

Working on this project I helped develop some simple D3 visualizations and help build out interactions between these visuals and the leaflet map to help a user isolate different county outliers when relating demographics to social isolation, COVID-19 outcomes, and more.
Final deliverables
The final mapping tool was published on the AARP website.