Formula Three
Formula Three is a scrollytelling website built with Three.js and GSAP ScrollTrigger.js to showcase the new 2022 features to the Formula One car.
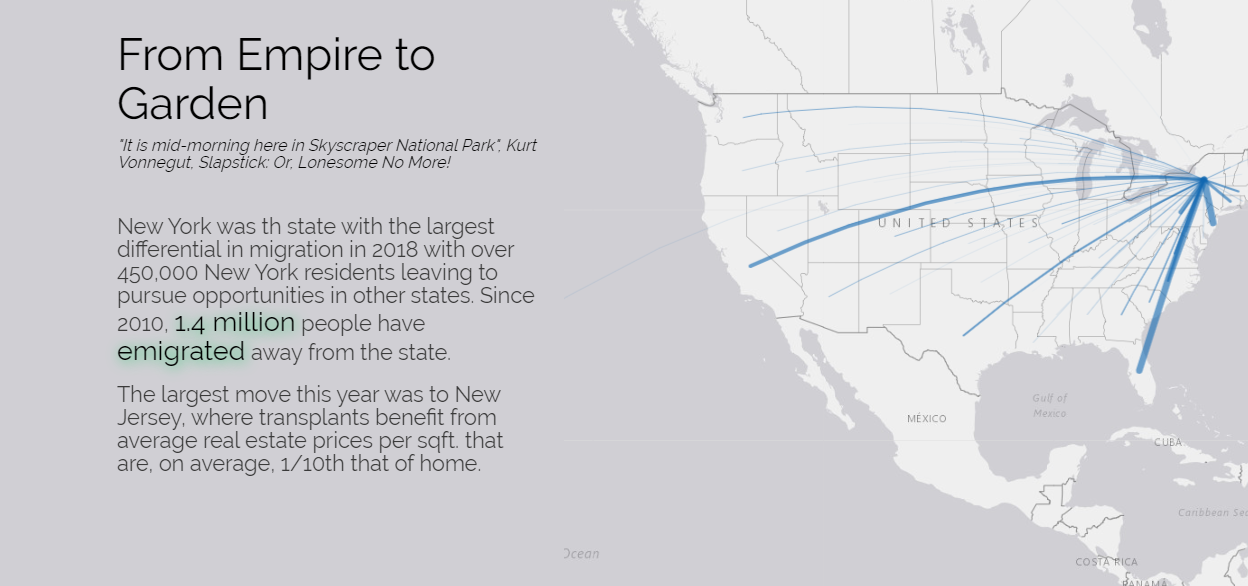
From Empire to Garden
From Empire to Garden is an exploration of state-to-state migration in the United States in 2018. Using U.S. census data, this interactive piece of scrolly-telling data journalism explores major trends over the year in migration.
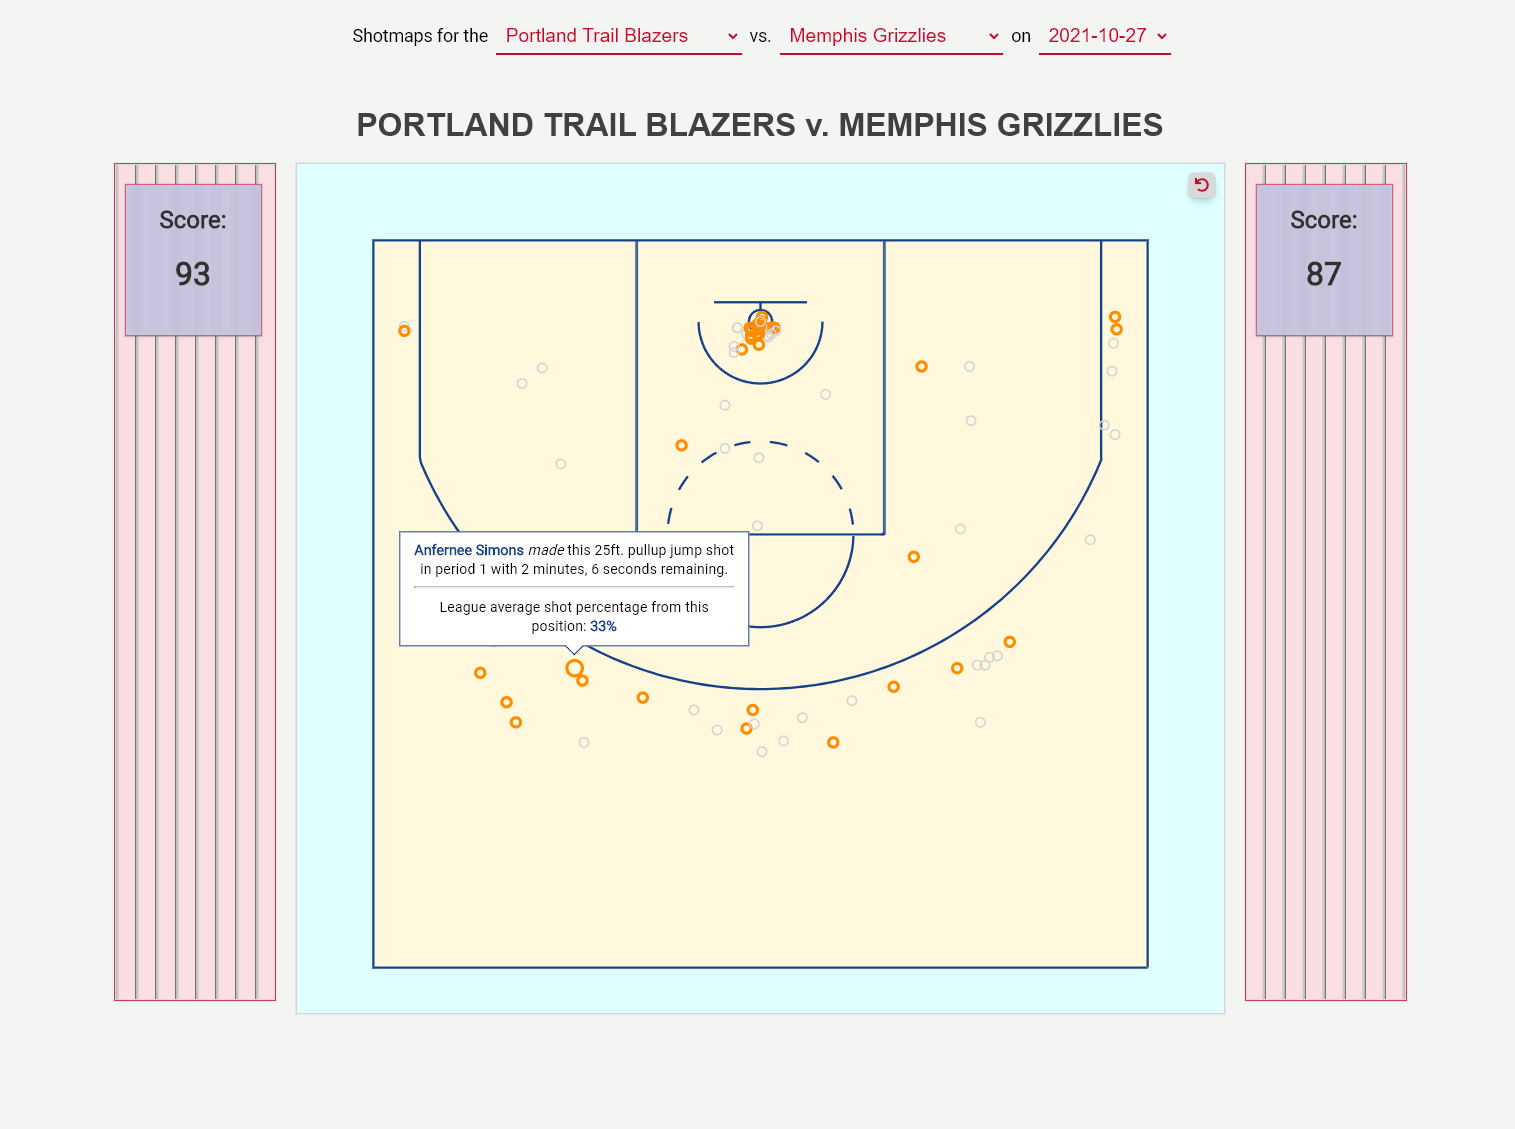
NBA Shotmaps Application
This small web application was built to display positional shot data from NBA games from the 2021-2022 season. It cleanly combines the declarative nature of Svelte with the utility of D3 scales to plot a base court and overlay positional data with hover animations and tooltips. It features a zoomable, scaleable SVG viewer wrapper component, so a user can zoom in on the court and see every shot taken for any NBA game.
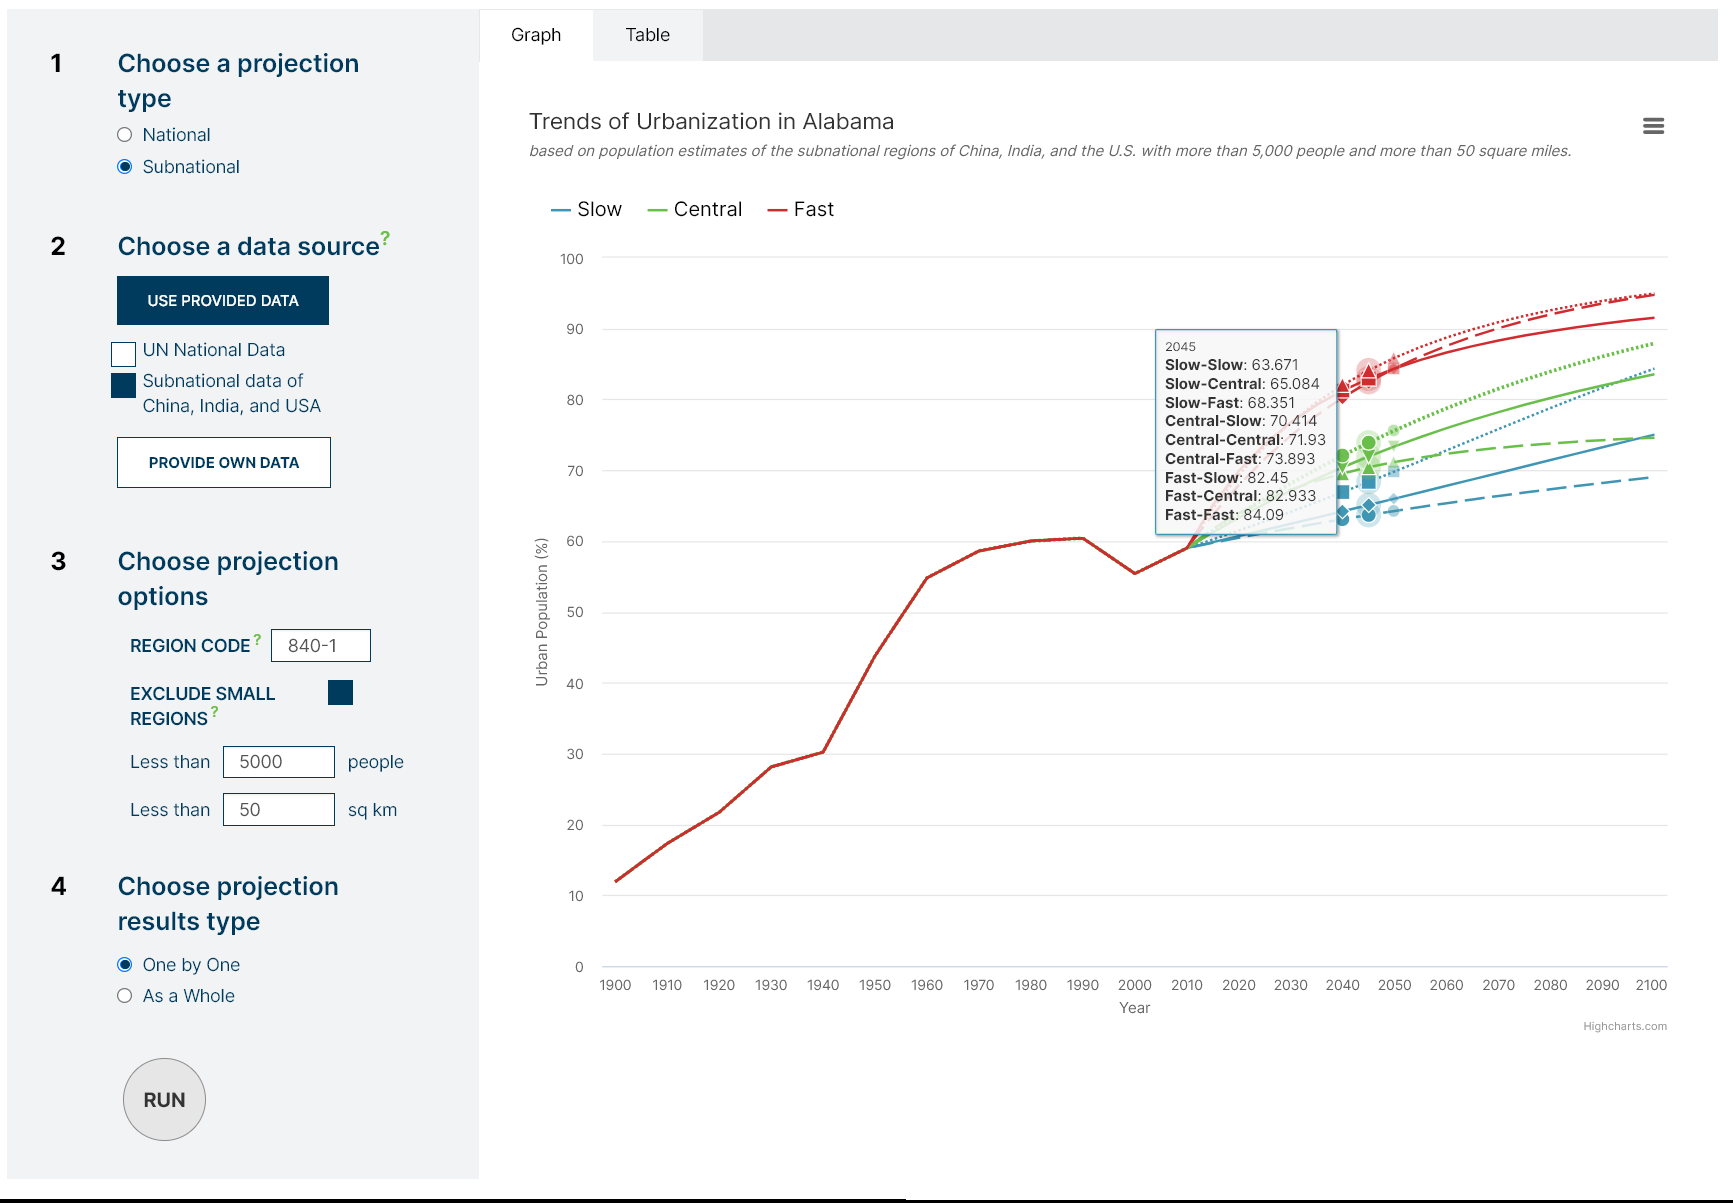
Population Council climate website
Working with Ensemble Media, I was contracted to make various dashboards for the Population Council displaying an attractive UI to generate various data visualizations showcasing modeled estimates of population, urbanization, and migration under various climate scenarios.
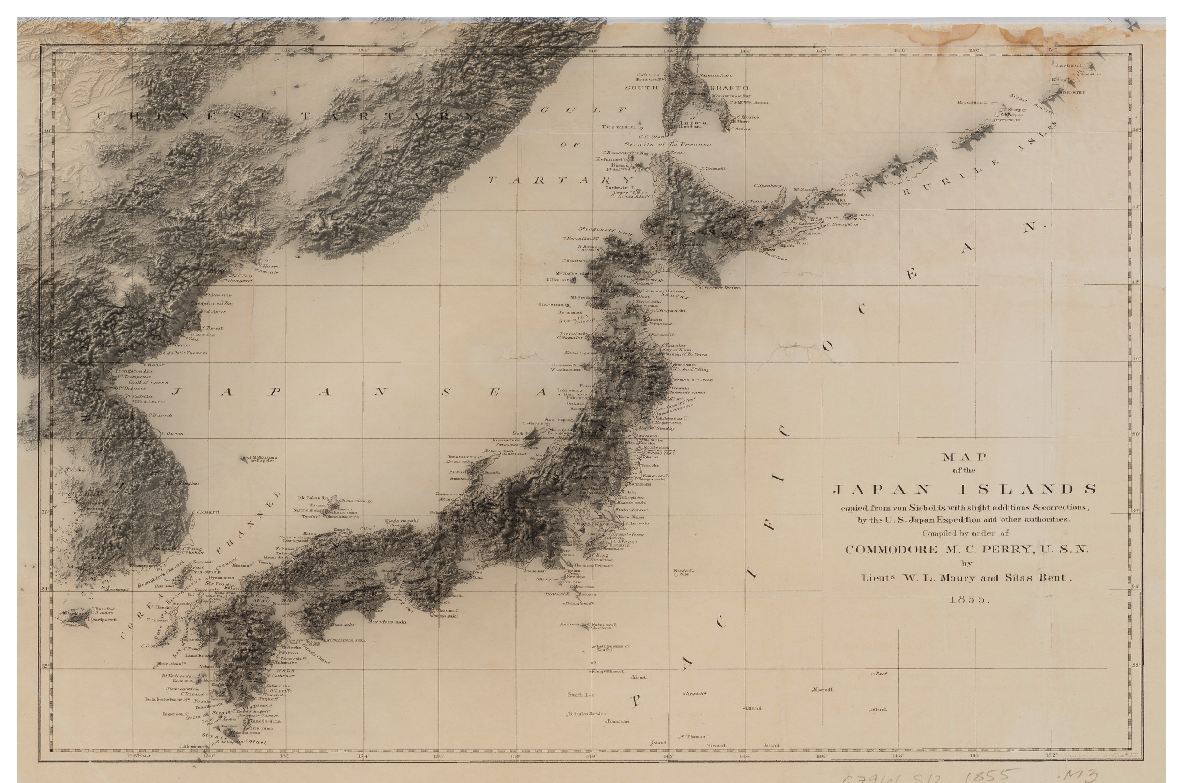
Historical elevation renders
Series of maps rendered in 2020 using a combination of QGIS to georeference, elevation data and historical maps sourced online, and Rayrender in R to render the elevation data.
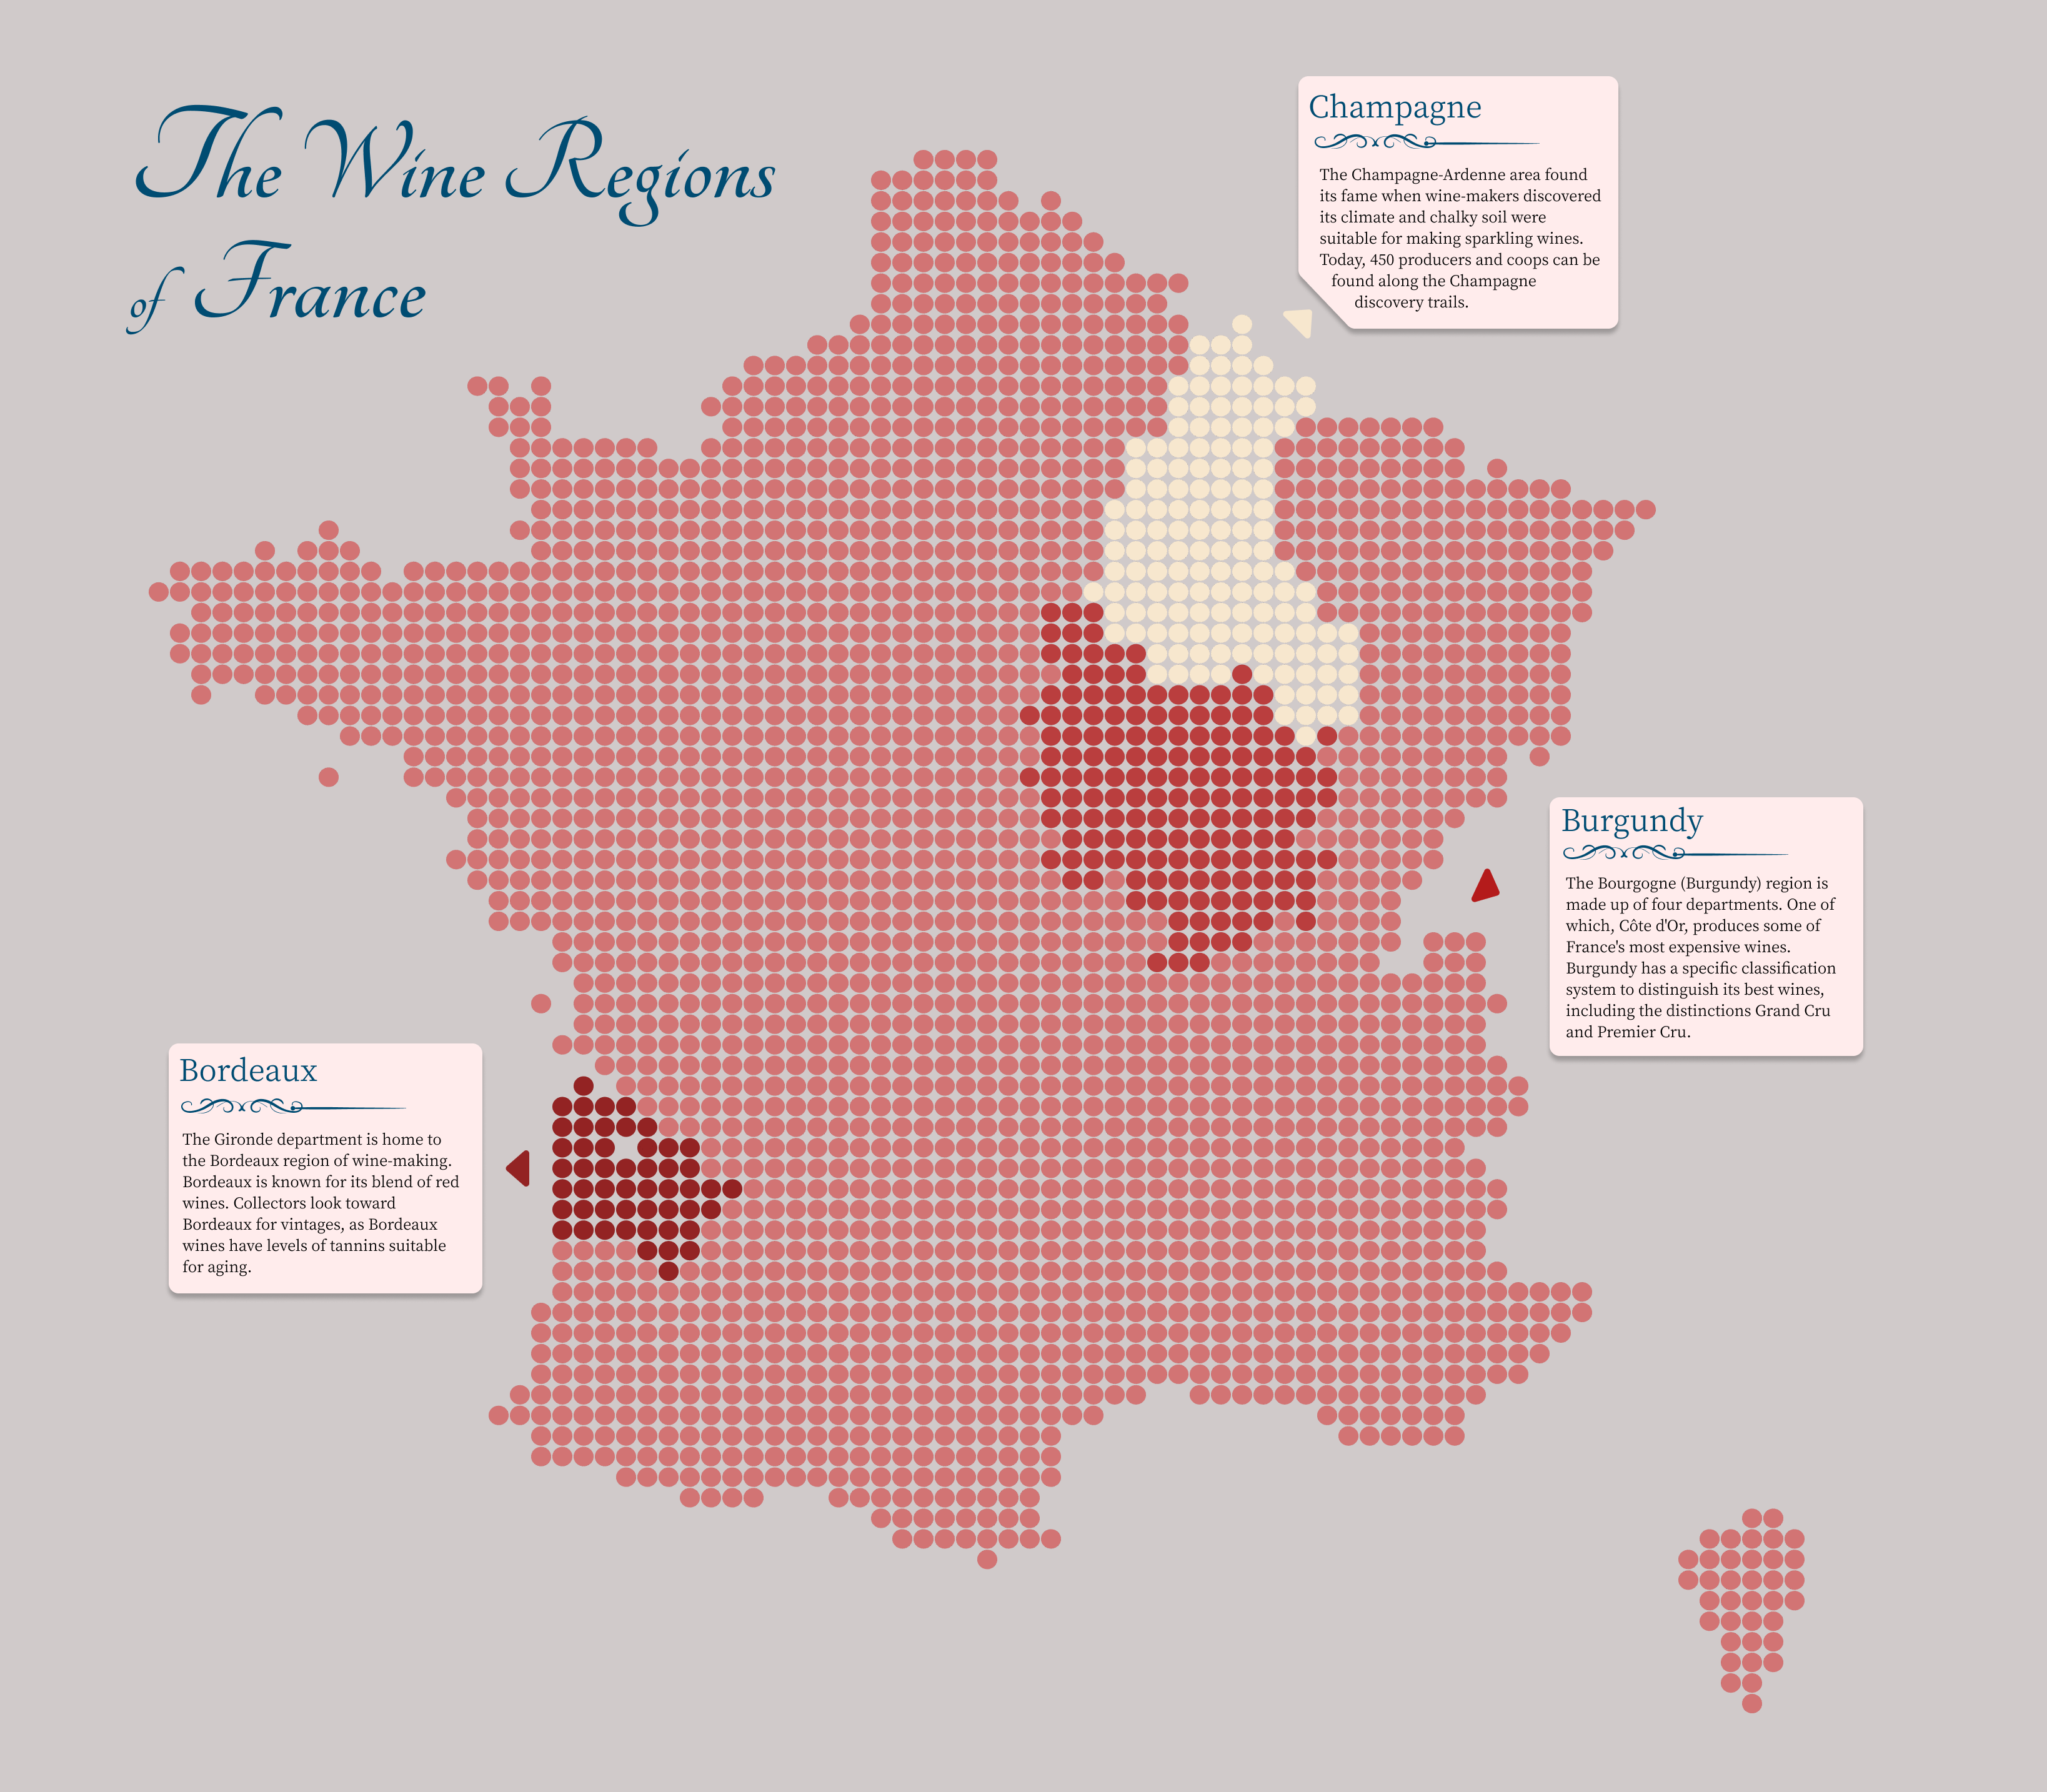
Wine Regions of France
This pixel map visualization portrays the departments in which the three most popular wine regions of France live.
Cyber City
This website was one of the first simple scenes I built to practice Three.js after completing Bruno Simon's Three.js Journey course. This small scene of a cyberpunk-esque city was built and lit in Blender. The scene was UV unwrapped and the textures were processed and baked to be used in Three.js
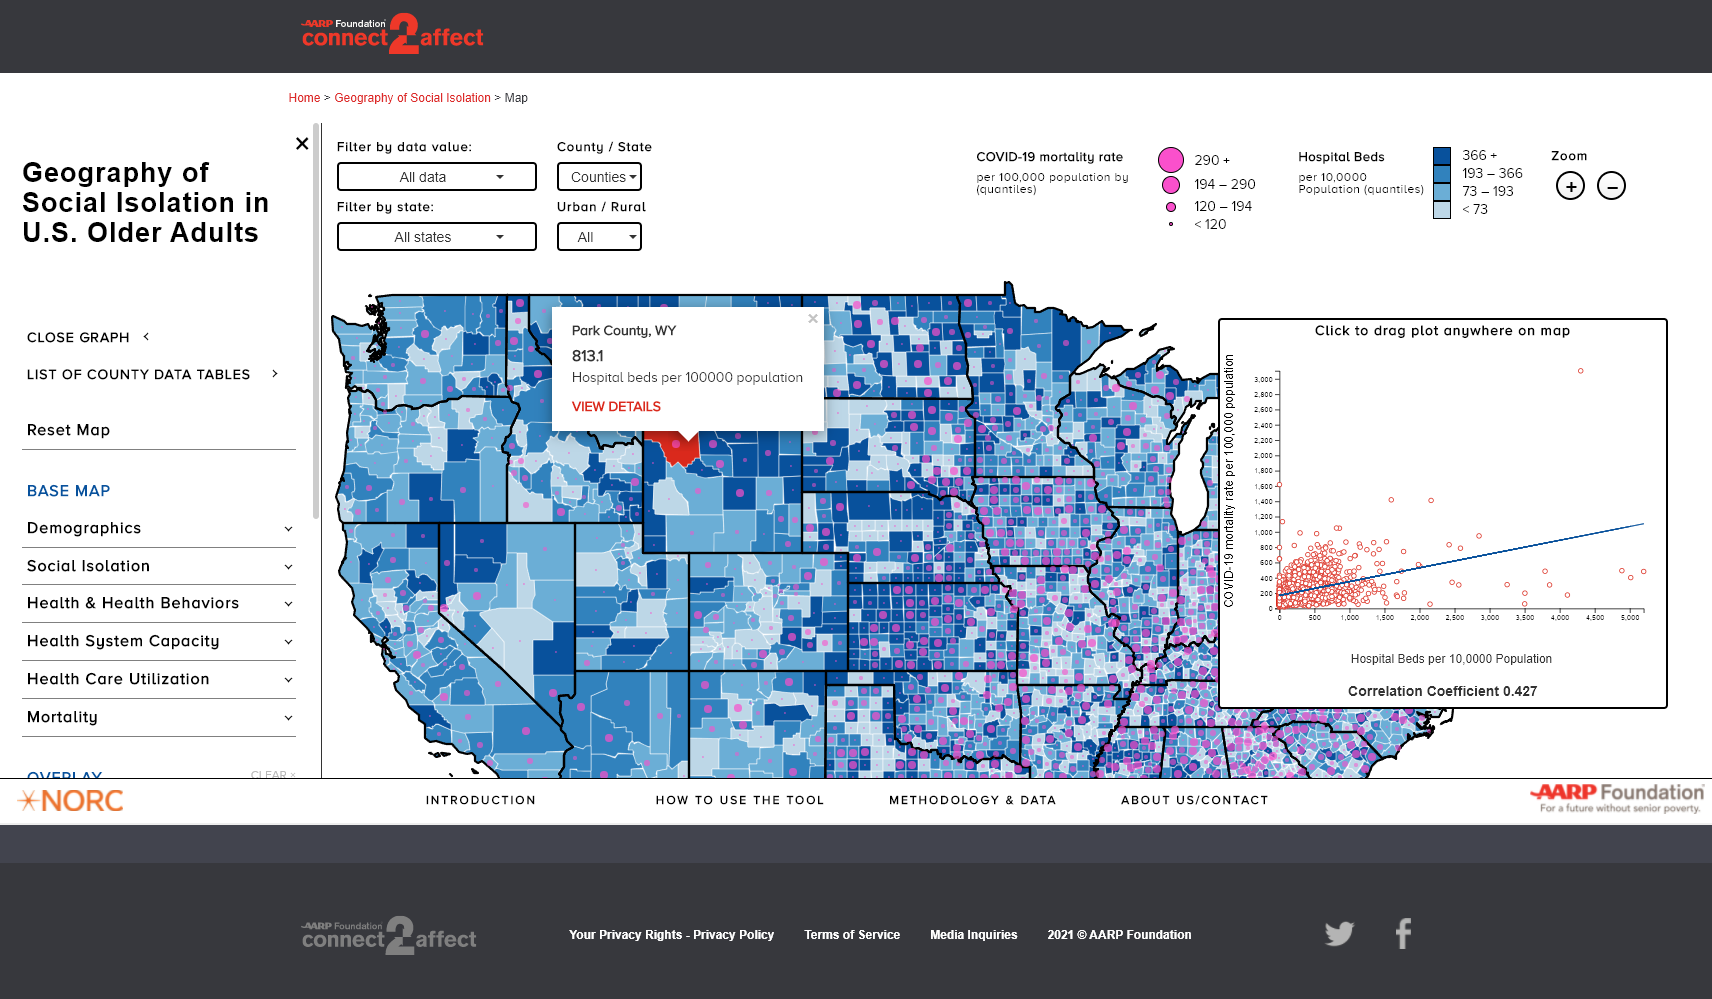
AARP social isolation mapping tool
While working at NORC, I helped develop this interaction map was for the AARP Foundation's connect 2 affect program. The map was designed to help visualize social isolation and loneliness in older adults in the United States during the COVID-19 pandemic.
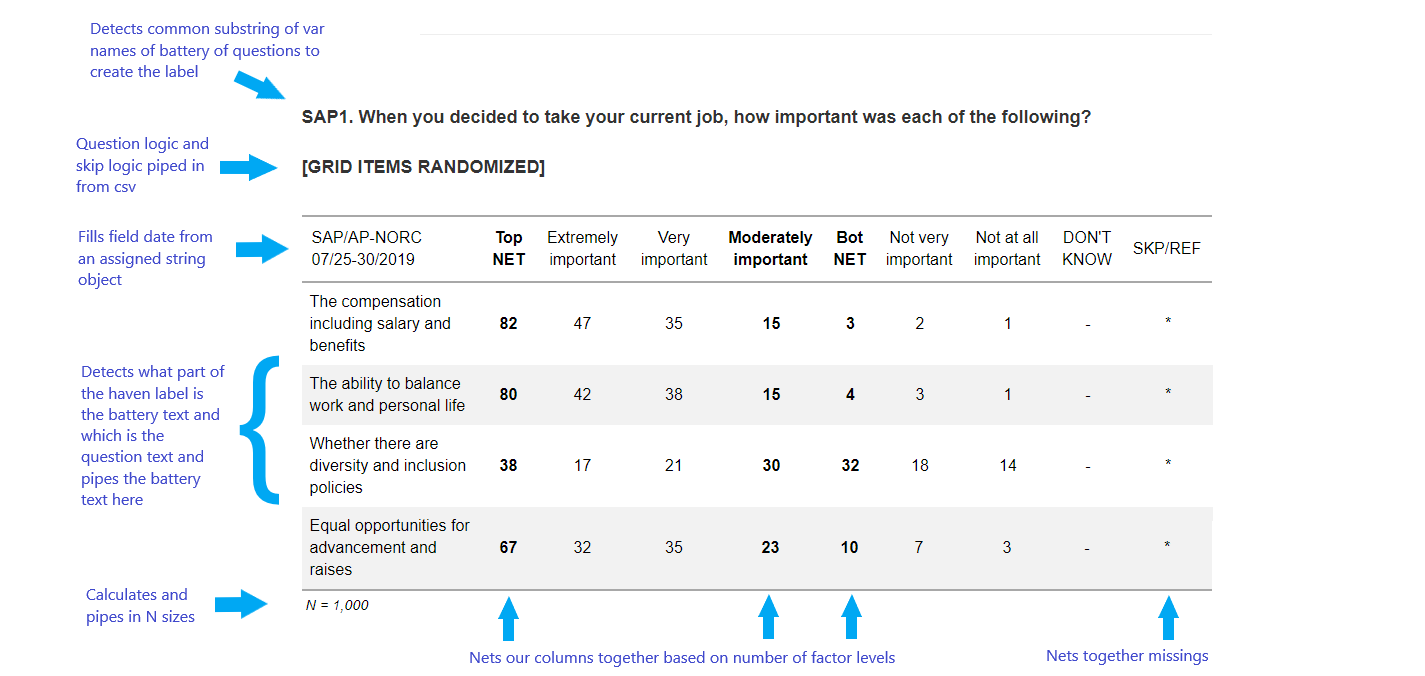
Banner and Topline Software
This project in design and analysis features work from multiple NORC Venture Fund awards to build software to automate reporting at NORC of topline findings documents and banner tablatures.
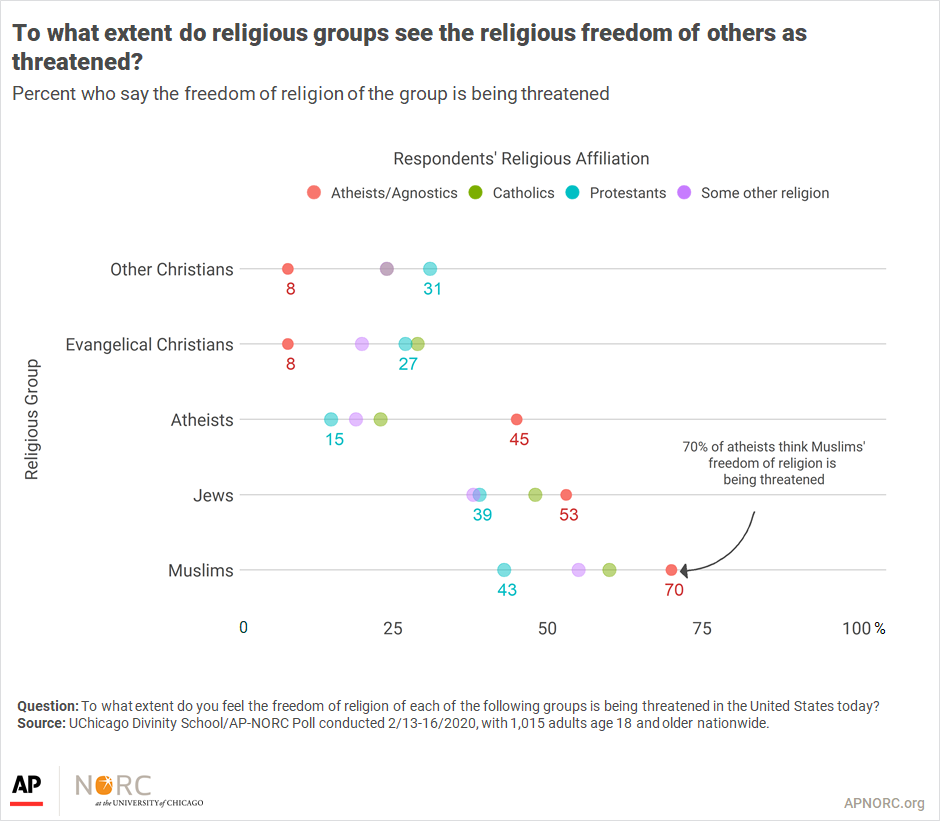
UChicago Divinity School Visualisations
A pair of partner visualisations created for the UChicago Divinity School depicts the extent various religious (and non-religious) groups view threats to their own and others’ religious freedoms.
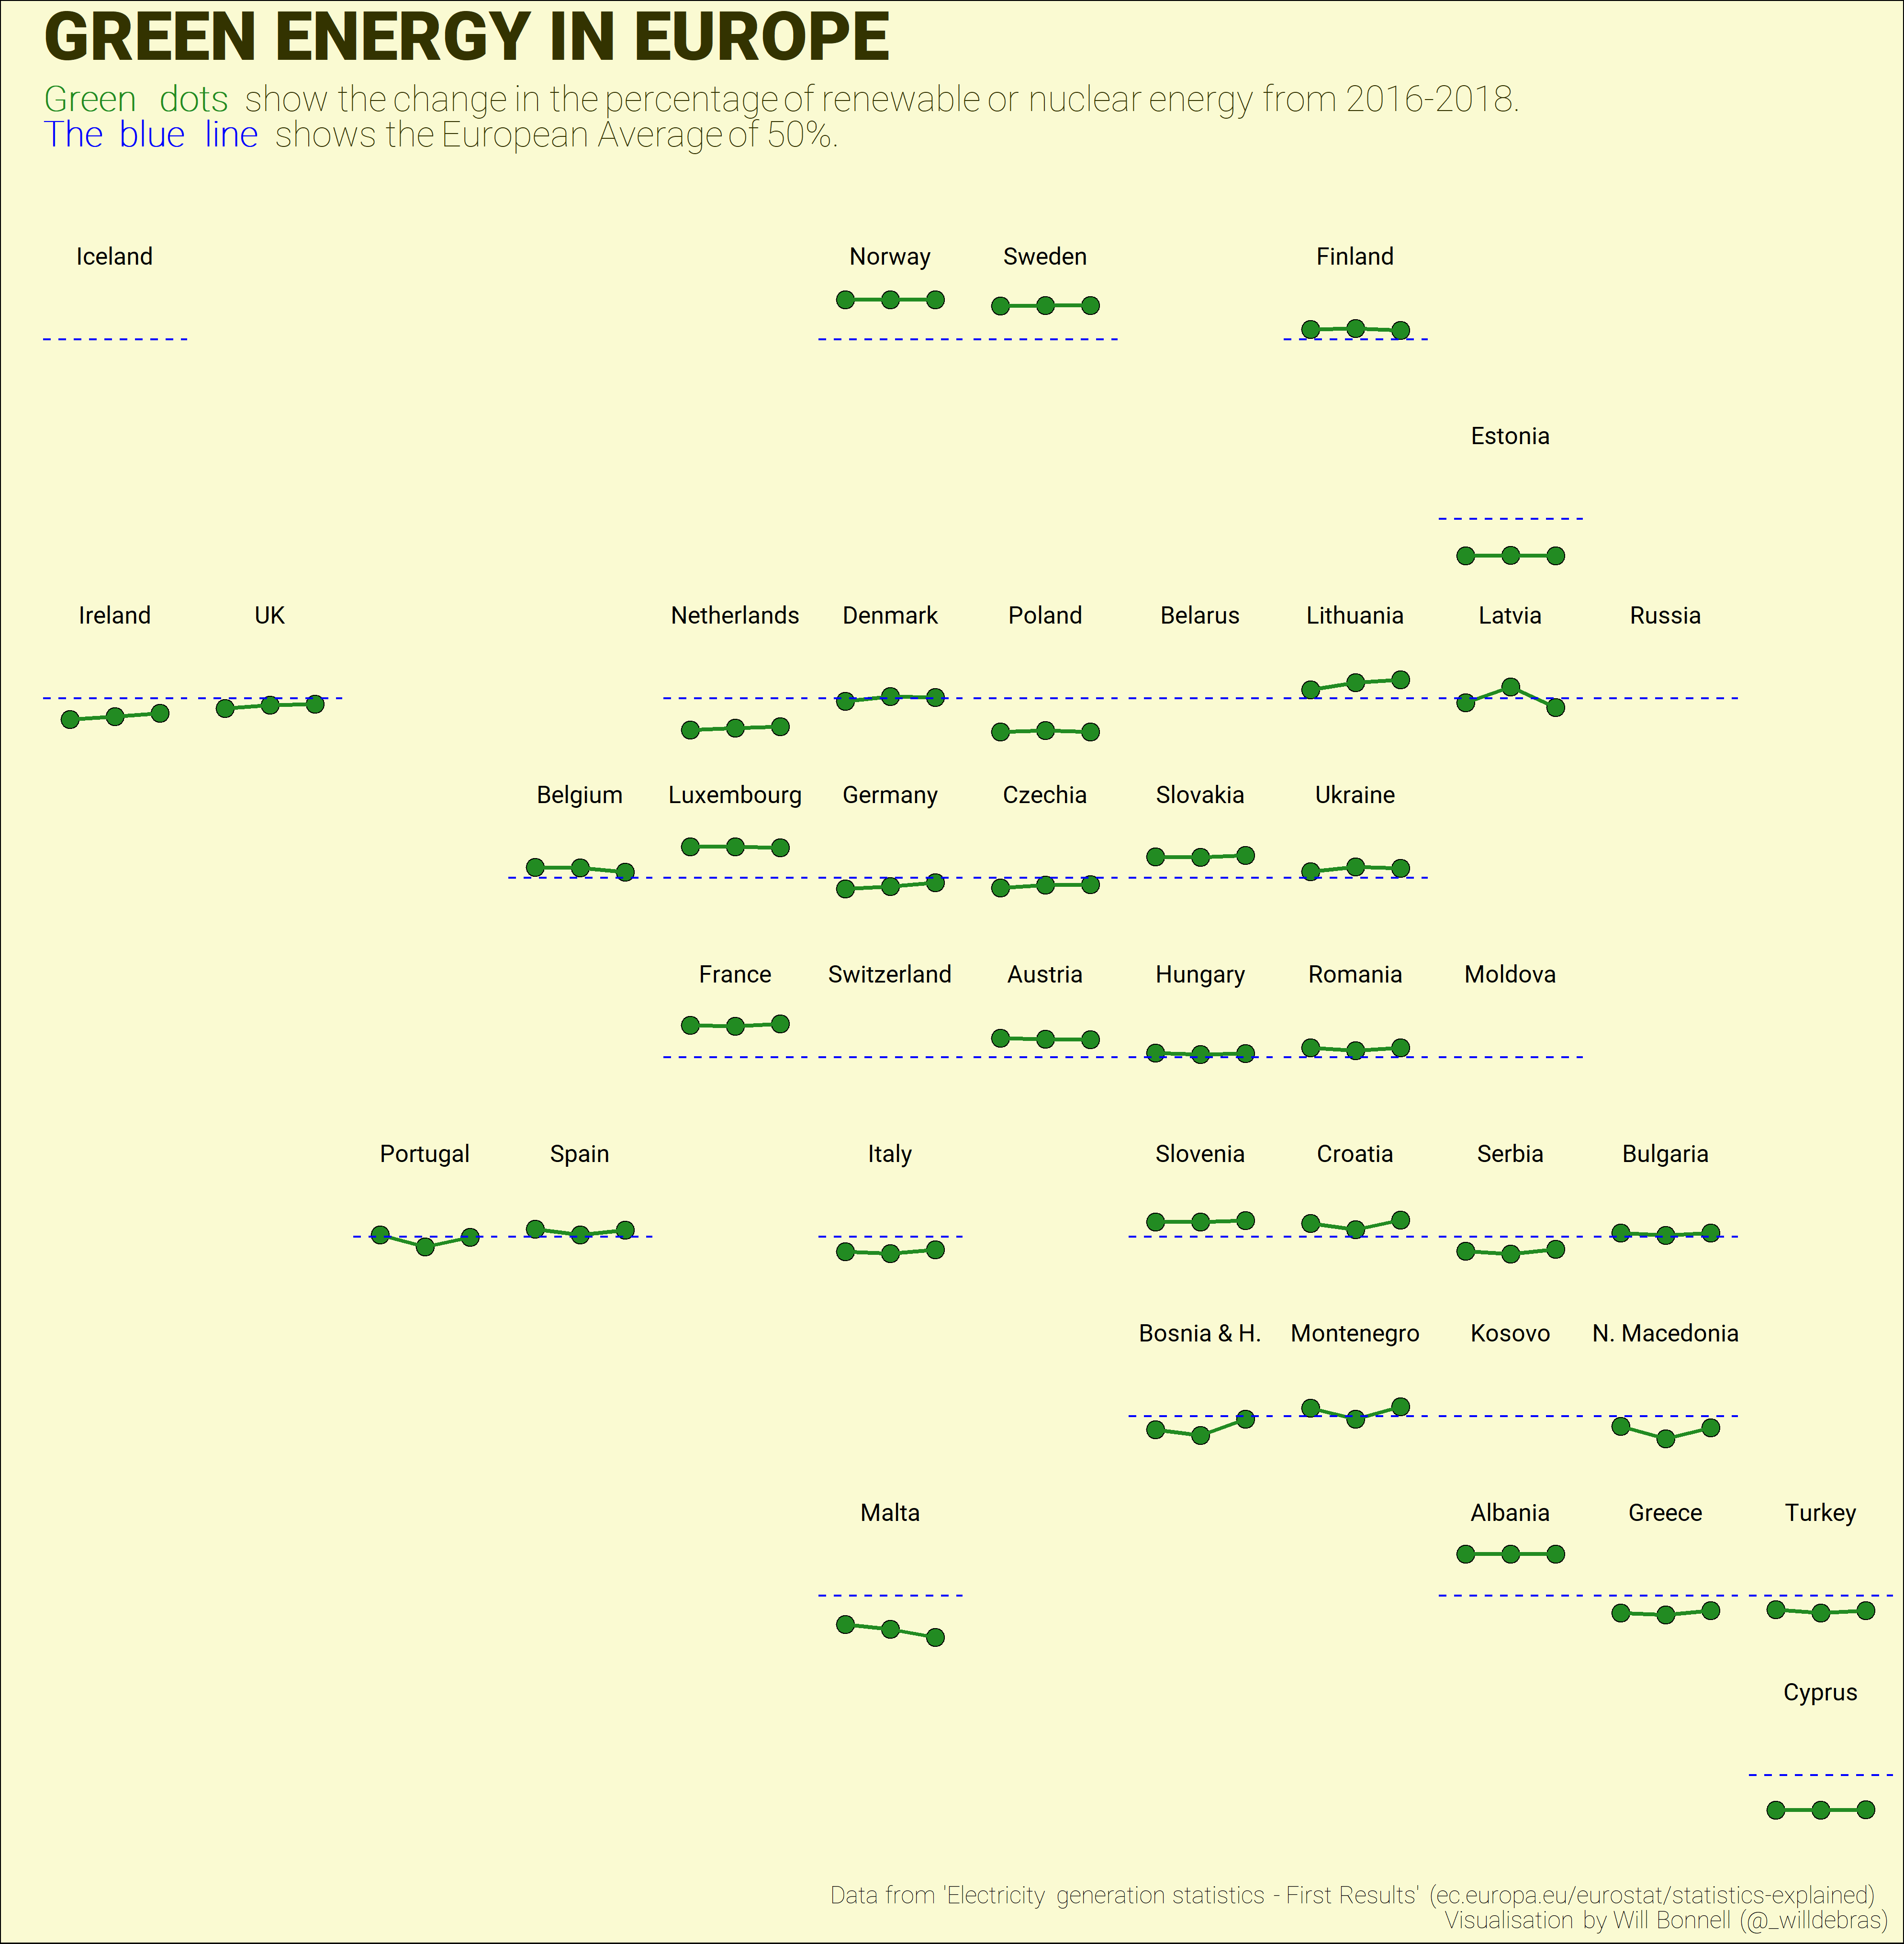
Green Energy in Europe
This visualisation was created for a Tidy Tuesday challenge of energy usage in Europe.
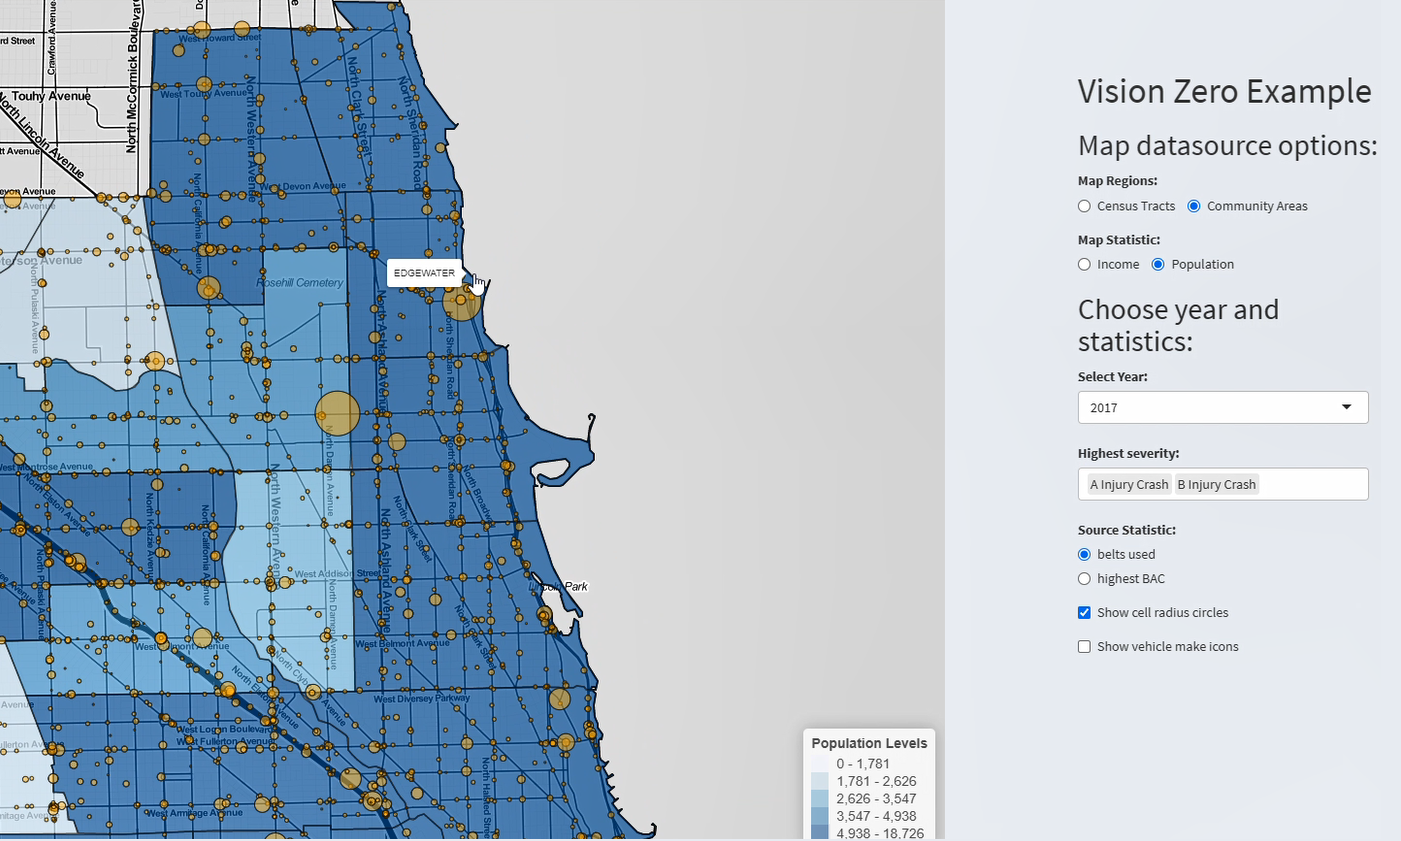
Chicago Vision Zero dashboard
A hackathon created dashboard to display traffic fatalities for the City of Chicago
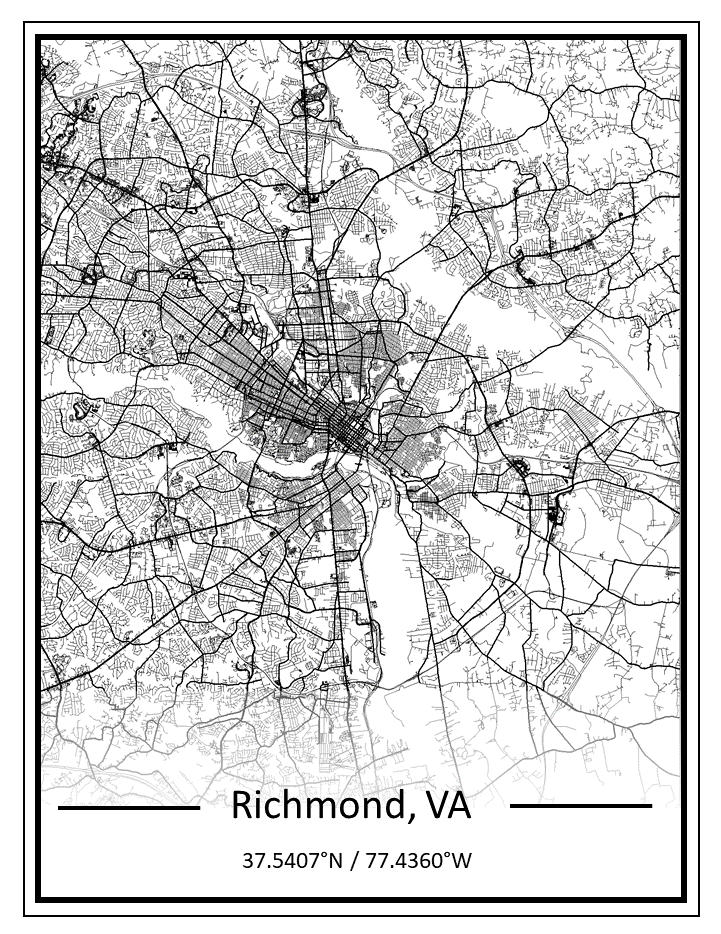
Streets of Richmond
A visualisation showing all of the streets of Richmond, Virginia. The image is my current header on willdebras.github.io.